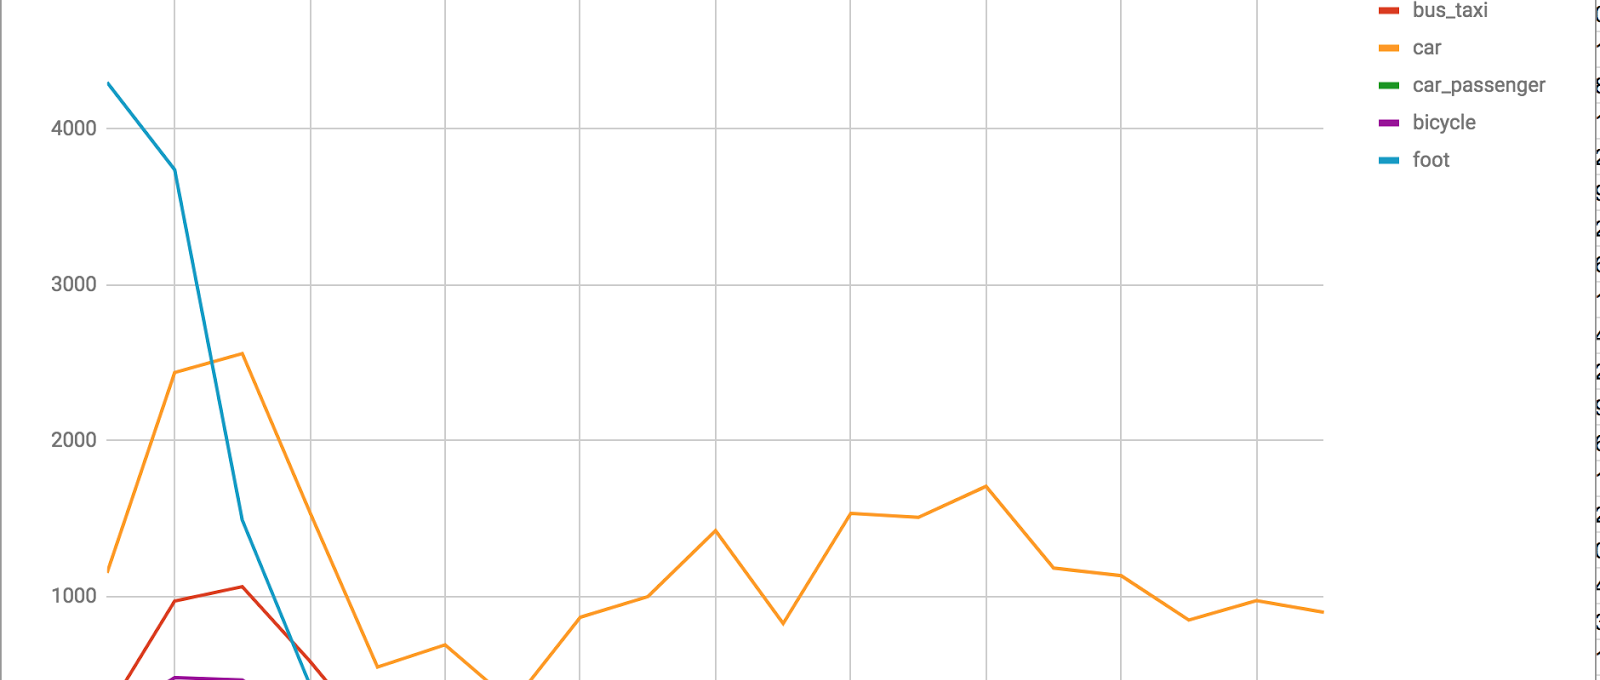
This is a summary of the ‘Making Census of Bath’s Transport Problems’ presentation Adam Reynolds, chair of CycleBath made on Saturday as part of the ‘Bath Digital Festival’.
His presentation is self-explanatory and doesn’t take too long to read, however we thought it might be useful to extract a brief summary.
The presentation analyses 2011 Census data to try to get a greater understanding of Bath’s traffic:
- 5.7% of people in Bath (city) cycle to work versus 1.8% in B&NES
- 41% walk to work versus 23% in B&NES
- Bath is in the top 4 ‘active’ (cycling and walking) cities (below Cambridge, York and Oxford)
- Most journeys are under 5 km – a reflection of the small size of the city (see graph above)
- 28,000 commute by car, of which 5,000 drive within a 20 minute walk, and 13,000 within a bike/ebike ride
- 20,000 commute into the city, and 9.000 within the city; P&R sites only 25% full by 9am
- Annual estimated cost of congestion £11million
The presentation then goes onto make a number of recommendations which we have previously reported on:
- Introduction of soft parking zones to dissuade commuters in Bath from making use of free parking outside the current resident’s parking zones; £17 million per year value to this current free parking
- Cycling makes 7 times better use of roads (density) than cars
- Cycling is good for your health – 40% to 50% reduction in death from cancer, heart disease; 28% in UK are obese but only 10% in the Netherlands
- ~100 deaths per year linked to transport in B&NES