For Bath Hacked weekend in February Bath and North East Somerset Council (B&NES) released almost 2 years of ½ hourly meter readings for most of their buildings. Transition Bath’s Energy Group were involved in the weekend and was part of team School Power! which was ultimately awarded a prize for using the energy data to look at gas and electricity consumption in B&NES’s buildings and in developing a prototype website to display similar data for schools.
Both during the event and with subsequent work we took a look at the ½ hourly meter readings to try to determine whether there were opportunities for B&NES to save money on their electricity bills and to make themselves more sustainable. The rest of the article contains the results of our analysis; there is a certain amount of guesswork involved in analysing the results and identifying potential savings which may not be accurate, and can only be confirmed following a full building survey. The analysis is brief given the limited time we have had on this project to date, but the data warrants further analysis.
From the analysis of B&NES public building electricity consumption, the top priorities are to replace the halogen lighting in the library (a £230,000 10 year saving) plus the Guildhall, and to investigate high baseloads at the Guildhall (40kW), Lewis House (40 kW) and Keynsham Civic Centre (35 kW)
An article on the prototype schools’ energy comparison and gamification website will appear at a later stage.
Summary
Further detail of individual buildings and recommendations below.
| Building | Annual Electricity Consumption kWh | Annual Cost | Baseload kW | Avg Peak | Floor Area m2 | Electric Consumption kWh/m2/year |
|---|---|---|---|---|---|---|
|
Guildhall |
550,000 |
£66,000 |
40 |
100 |
6372 |
86 |
|
Lewis House |
440,000 |
£52,800 |
40 |
80 |
3000 |
147 |
|
New Keynsham Civic Offices |
315,000 |
£37,800 |
35 |
100 |
9500 |
33 |
|
Bath Central Library |
270,000 |
£32,400 |
6.3 |
70 |
2000 |
135 |
|
Hollies Midsummer Norton |
157,000 |
£18,840 |
12 |
35 | ||
|
New Keynsham Civic Centre Car Park |
52,000 |
£6,240 |
6 |
8 | ||
|
Paulton Library + Hub |
32,000 |
£3,840 |
2 |
9 | ||
|
Radstock Library |
25,000 |
£3,000 |
0.5 |
16.5 | ||
|
Midsummer Norton Library |
23,000 |
£2,760 |
1 |
6.5 | ||
|
Moorland Road Library |
11,000 |
£1,320 |
1.8 |
3.5 | ||
|
Saltford Library |
8,000 |
£960 |
0.25 |
5 | ||
|
Weston Library |
7,000 |
£840 |
0.25 |
3 | ||
|
Hollies Car Park |
3,000 |
£360 |
0.1 |
0.75 | ||
|
Total |
1,893,000 |
£227,160 |
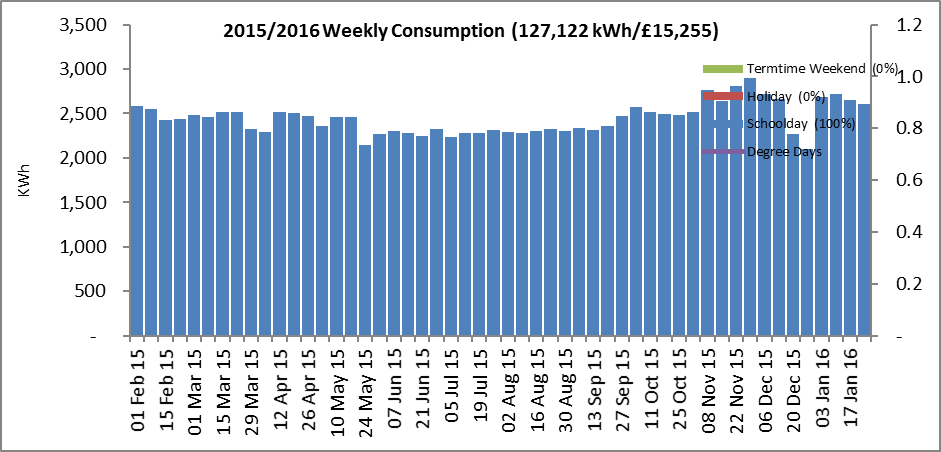
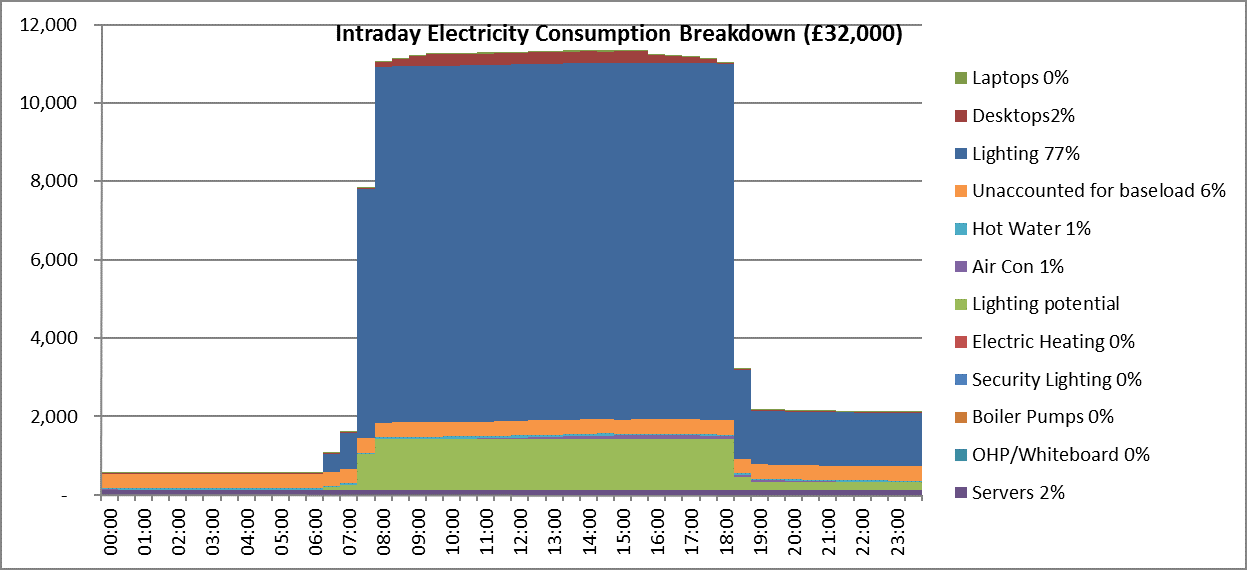
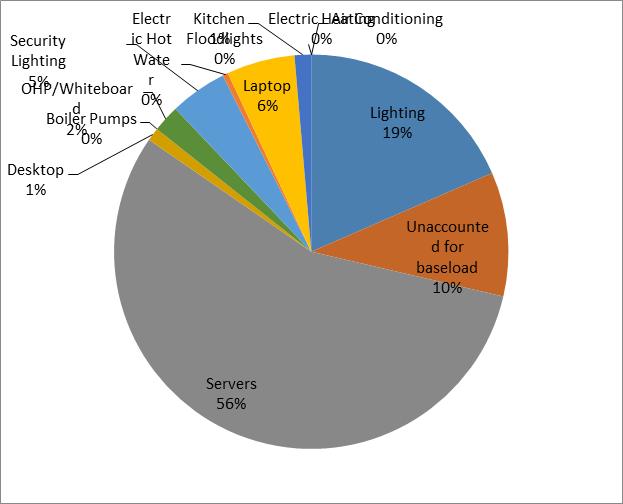
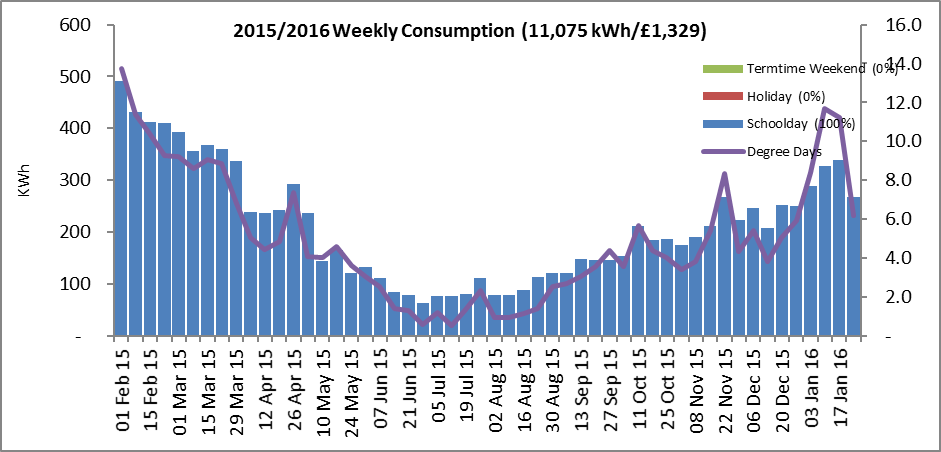
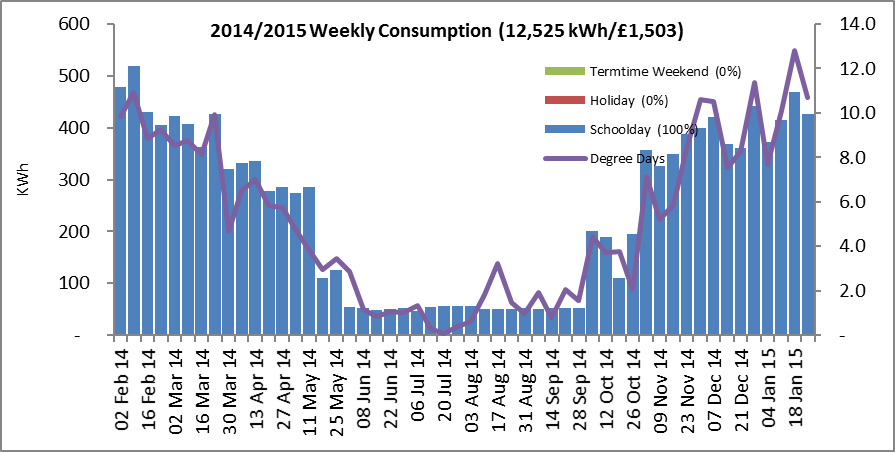
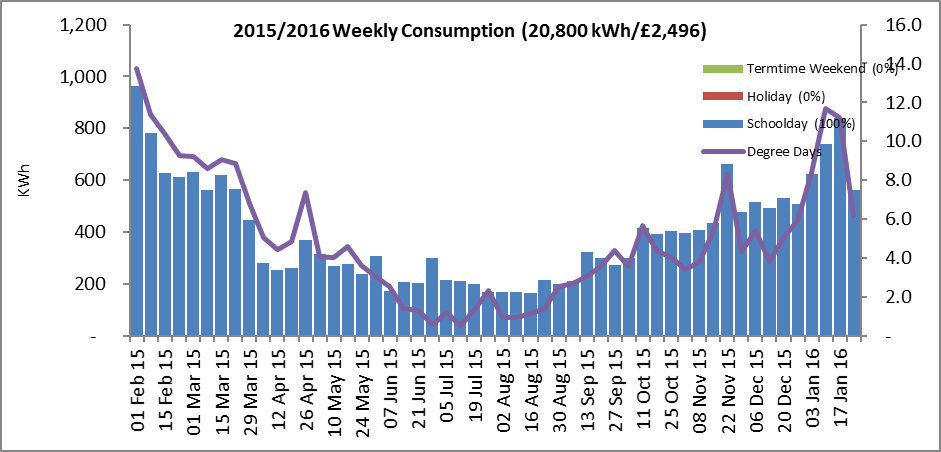
Bath Central Library
Has an annual electricity consumption of about 275,000 kWh/£32,000 for a floor area of about 3,000m2, so 135 kWh/m2/year which is quite a high figure. We had previously identified that the library was lit with halogen bulbs, which if replaced could reduce the lighting consumption and that of the air conditioning by up to 80%.
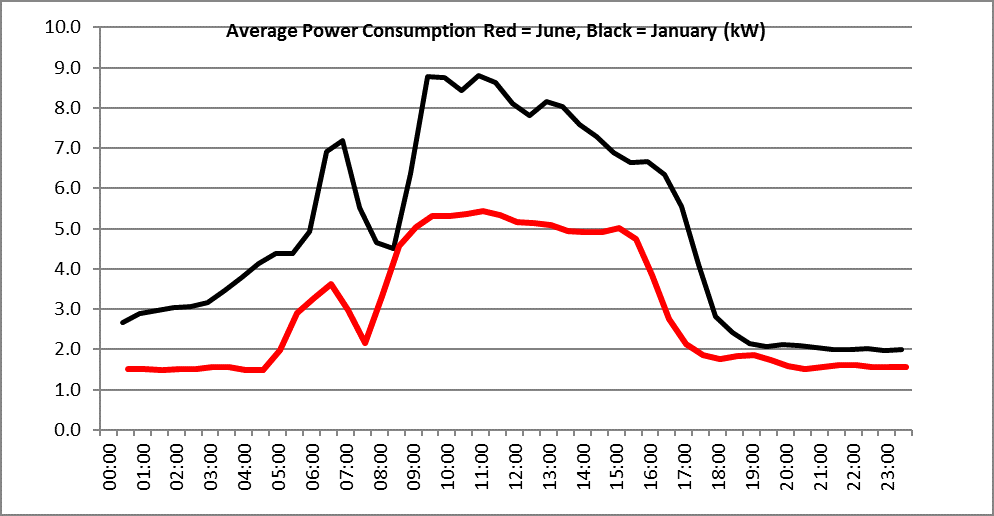
Current intraday consumption aggregated over year:
Our modelling suggests 77% of the building’s electricity is consumed by lighting which is very high:
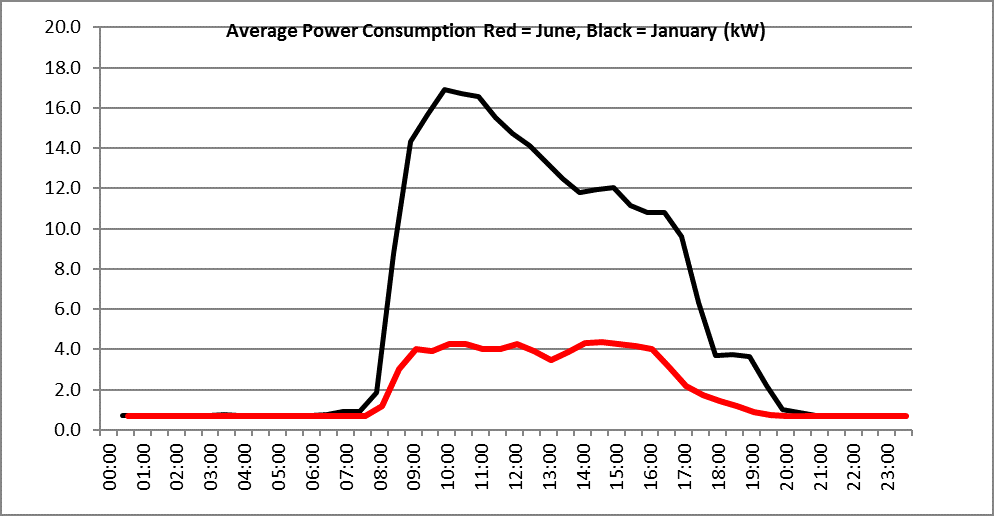
Change in consumption if halogens were replaced with LEDs:
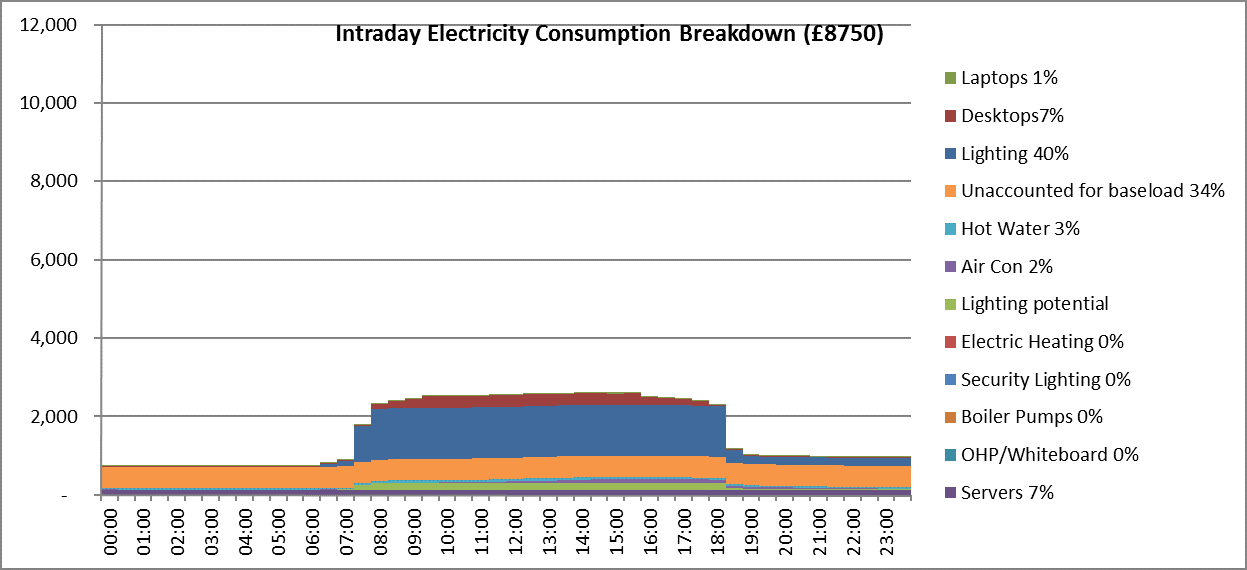
There is potential to reduce annual consumption from £32,000 to £8,750, a saving of £23,250, so a £230,000 saving over 10 years – well worth the investment of upgrading the lights.
Recommendation: replace halogens with LEDs
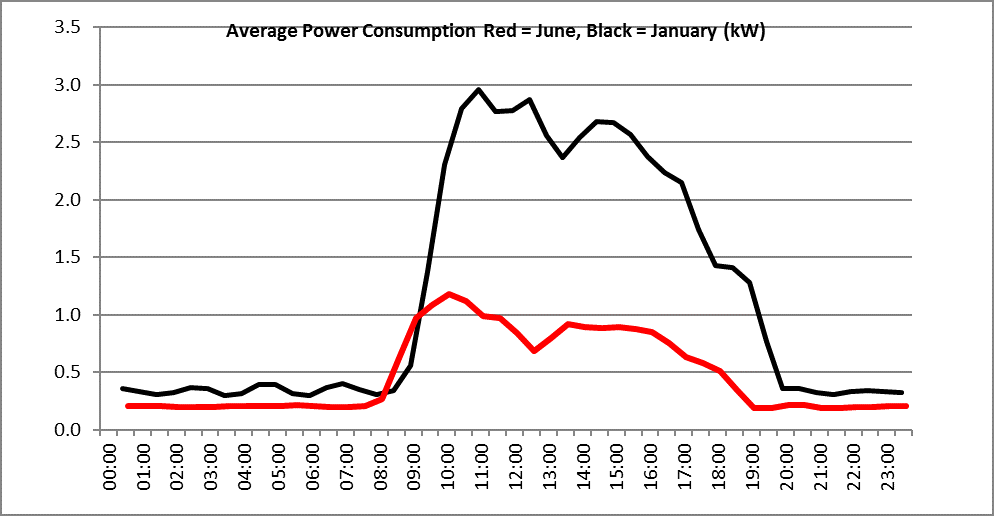
New Keynsham Civic Centre
Consumes about 315,000 kWh of electricity per year for a floor area of about 9,500m2, so a consumption of 35 kWh/m2/year which is very low for a building of this type. The building was designed from the outset to be sustainable with a target DEC rating of ‘A’. The building also has a considerable 243 kWp of solar PV on the roof.
By modelling the internal consumers in the building we can get a rough idea what might be consuming electricity in the building:
In reality it appears the building probably consumes 430,000 kWh of electricity each year, but this is offset by 220,000 kWh of solar PV, of which 135,000 kWh is consumed onsite and 85,000 kWh exported (mainly during sunny summer weekends).
Intraday mains power consumption looks like this during work days:
The main opportunity for saving electricity is probably from reducing the 40 kW (out of hours) baseload, which we presume mainly comes from servers? We understand that waste heat from the servers is used to heat the building during the winter, although we have heard comments from the occupants that the building sometimes overheats.
The building is in the process of being commissioned so some of this analysis of this building might be premature?
Recommendation: investigate 40 kW base load
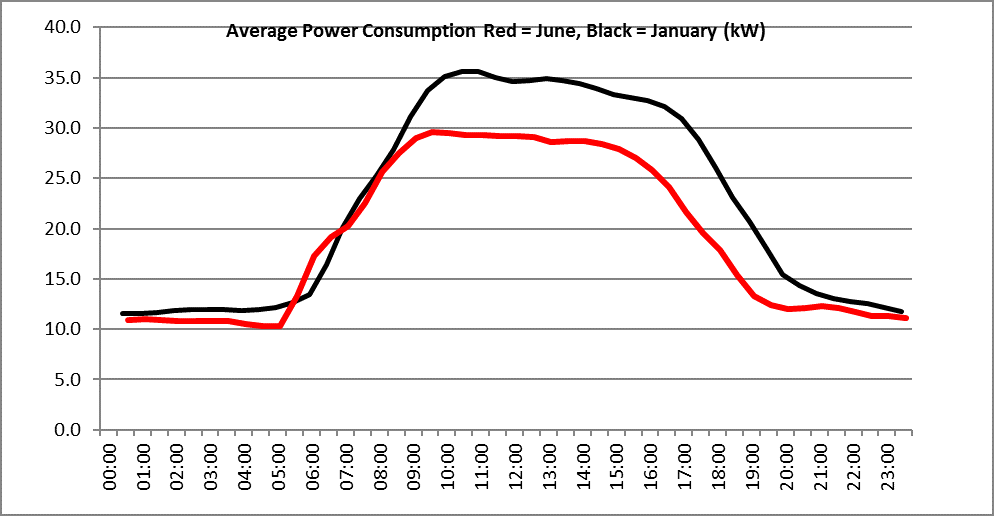
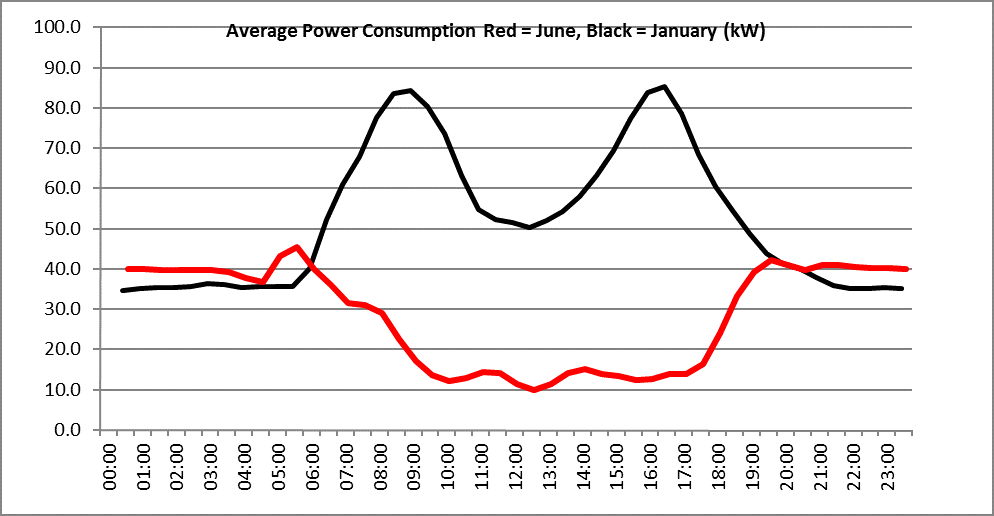
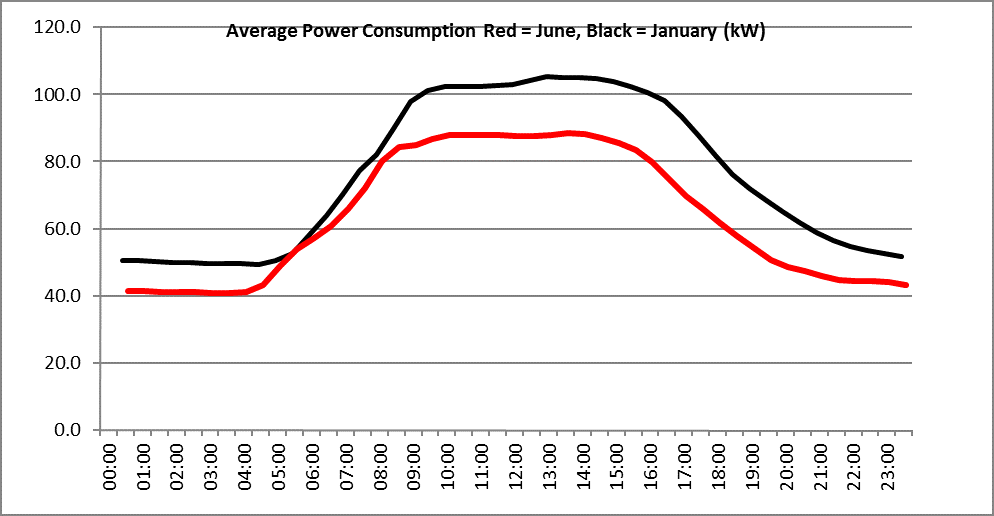
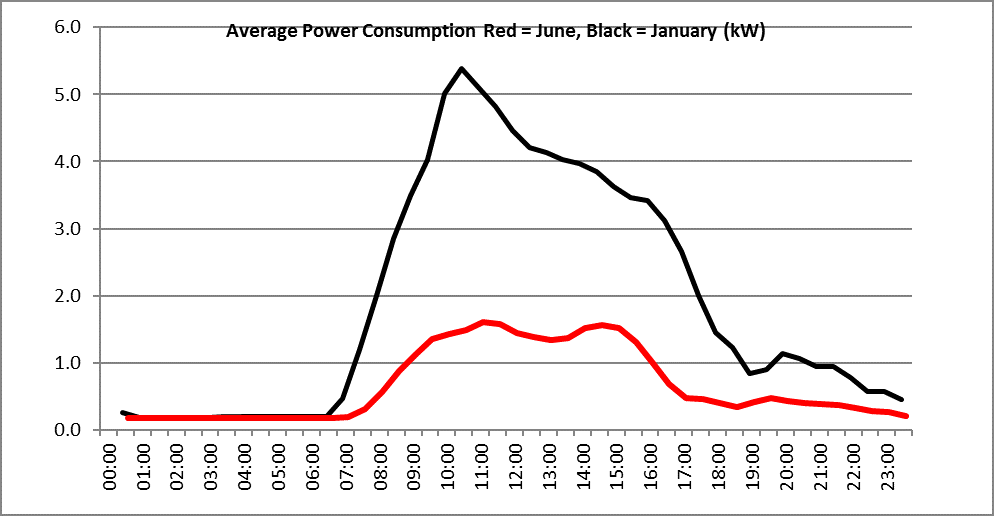
Lewis House, Manvers Street
Lewis House on Manvers Street is a council office in the centre of Bath, with an annual electricity consumption of 440,000kWh/£52,000 per annum for a building of about 3,800 m2. This is 120 kWh/m2/year which is about 50% higher than you would expect for a building of this size. The building has 37 kWp of solar PV which was installed in October 2014. The building was recently refurbished to include occupancy lighting, new gas boilers and double glazing.
The average June and January power consumption by time of day is as follows:
Its difficult to understand why the building has a 40 kW baseload without further knowledge of the building, but 40 kW is quite a large base load when the building is empty. January daytime consumption. Most of the difference between the June and January peak power is likely to be the better solar PV output in the summer.
Recommendation: investigate 40 kW base load
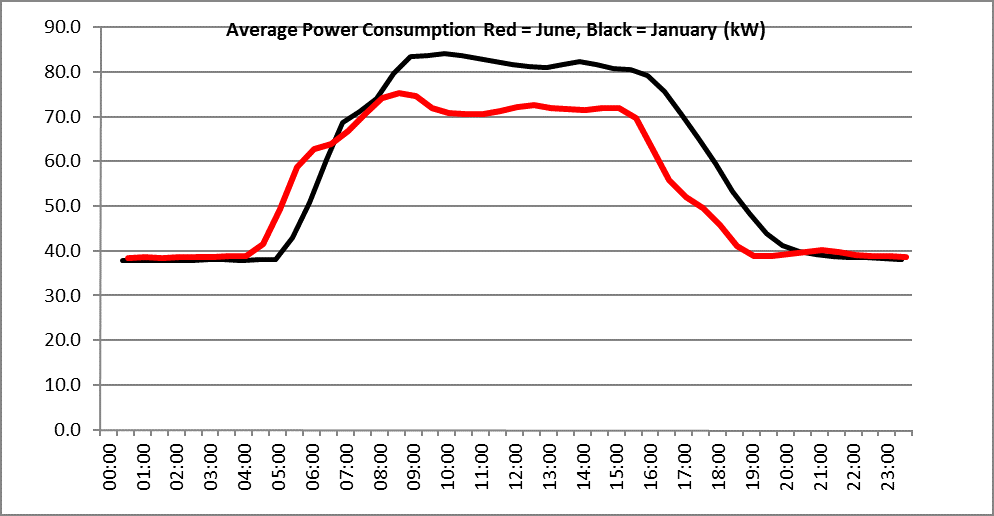
Guildhall
The Guildhall is the largest electricity consumed of the buildings for which we had AMR data supplied, consuming 550,000 kWh of electricity at a cost of £66,000 per year.
The most immediate opportunity for energy reduction might be trying to work out why weekend consumption is so high at weekends. Although the Guildhall is used at weekends, it has much less intensive use than during the week, and as such the weekend consumption looks higher than would be expected:
The base load is also high:
Recommendation: replace halogens with LEDs, investigate 50 kW base load, and weekend usage
Keynsham Civic Centre Car Park
Has some curious intraday consumption patterns:
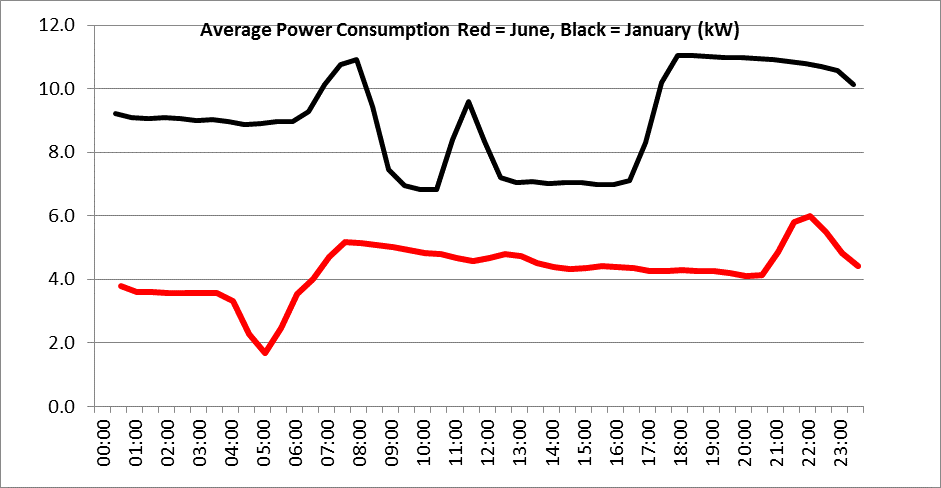
It is not clear why the out of hours’ baseload would be 4 kW in the summer but jump to 9 kW in the winter? Some of the winter consumption seems to be coming from lighting, and there is a peak around 8am which might be a ticket barrier?
Recommendation: try to determine why there is a difference in the summer and winter baseload?
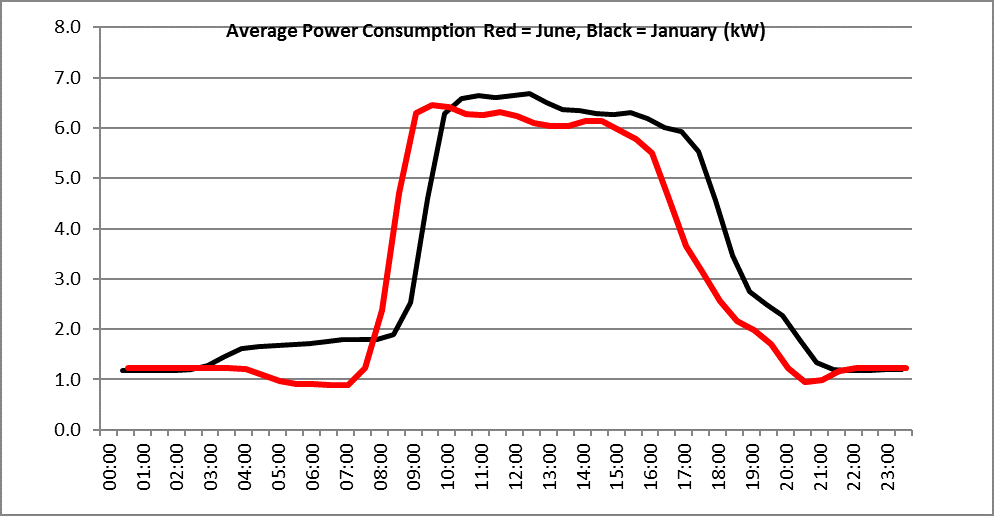
Midsummer Norton Library
This building looks relatively well managed, with low (1 kW) base load, and peak usage of 6 kW probably from lighting:
Moorland Road Library
Again a relatively low electricity user, but it is however strange why the consumption doesn’t change that much from daytime to night-time, and why winter overnight usage is higher than in the summer?
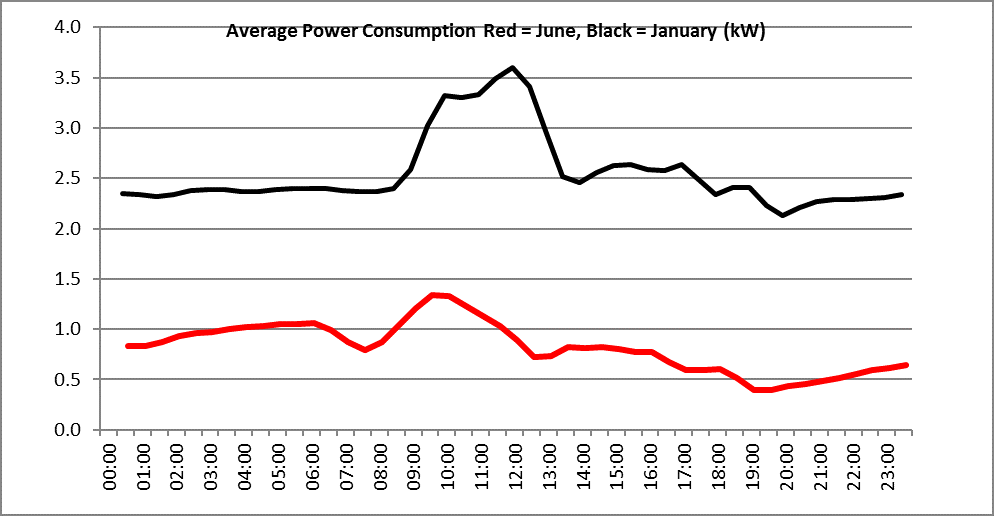
The graphs appear to be consistent (although we have not visited the site) with electric heating being on 24×7 365 days of the year, as the energy consumption seems to be correlated with outside temperature. In the summer of 2014/2015 the heating appears to have been turned off. Energy savings might be possible with timers on the heating, so that it turns off at night, and other times when it is unoccupied? Its current hours are: “Tuesday 09:30 – 12:30 & 13:30 – 19:00, Thursday 09:30 – 13:00, Friday & Saturday 09:30 – 12:30 & 13:30 – 17:00”.
Recommendation: investigate whether the consumption is caused by electric heating not on a timer
Paulton Library plus hub
There is a strange peak in usage at 6.30am in the morning, this could be boiler pumps, cleaners or the caretaker opening up, consuming electricity for lighting and/or vacuum cleaner?
Radstock Library
A low user, probably not worth further investigation for the moment.
Saltford Library
Looks like most of the power consumption is probably lighting, with perhaps some heating as well (low outside temperatures seems to have slightly higher electricity consumption).
Weston Library
A low user, so probably not worth further investigation?
Hollies Car Park
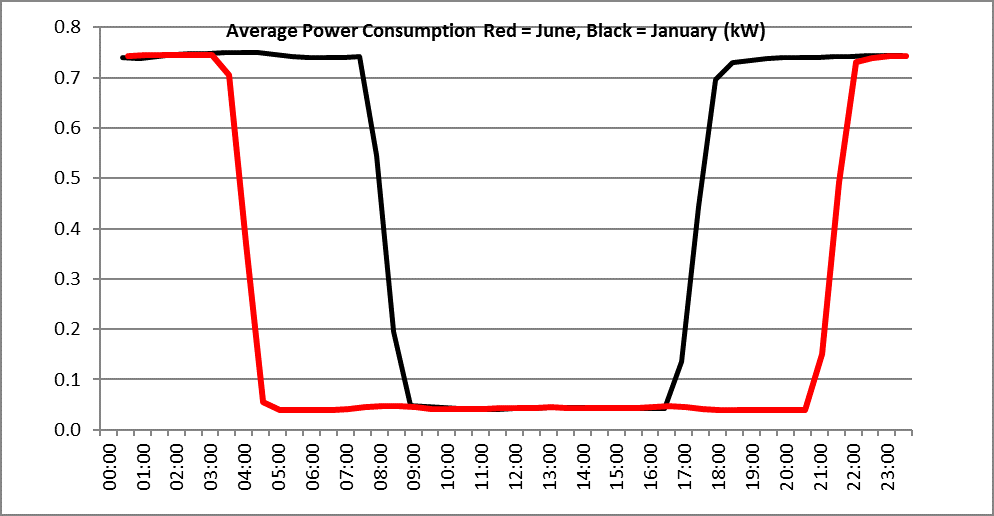
The power graph above demonstrates the classic profile of well controlled street lighting – i.e. it turns on and off at dawn and dusk, whose periods vary throughout the year.
Hollies Midsummer Norton
This is the 5th largest consumer of electricity of the buildings provided. The building is someway from the centre of Bath and we don’t know what it is used for, so any further comments are probably premature, until we have visited the building. There are no immediate comments we can make apart from the consumption patterns appear dominated by a 10 kW baseload, plus lighting during the day.