Summary
This first of a number of instalments of Transition Bath’s Carbon Descent Plan which we plan on presenting over the next year. The plan is to look at the trajectory of Bath’s energy consumption and renewable energy production to see what impact they have on Bath’s carbon emissions over the next 15 years.
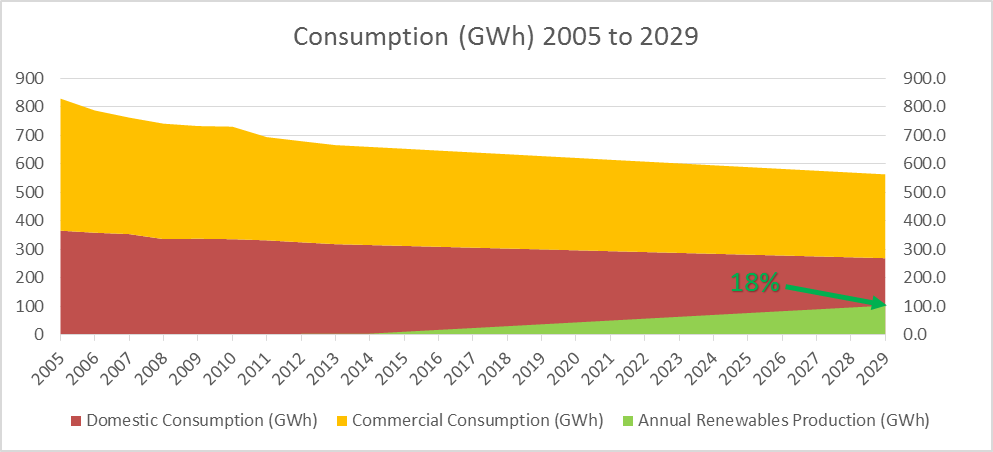
In this first part we look at B&NES’s current and future electricity consumption and renewable electricity production trends. The analysis below suggests in 15 years’ time by 2029 renewable electricity in the B&NES area has the potential to provide 18% of B&NES’s electricity consumption and carbon emissions from existing electricity consumers will have reduced by 87%:
- Our analysis shows that with efficiency measures annual electricity consumption should drop from 660 GWh to 563 GWh over the 15 year period from 2014 to 2029, a reduction of 15%
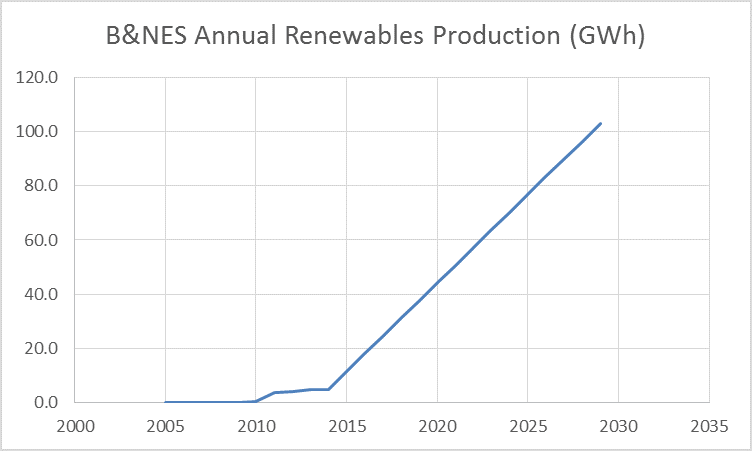
- During the same period annual renewable electricity production rises from 5GWh to 103 GWh a 20 fold increase
- It is assumed that most of this production will be from solar PV with a capacity of 120 MWp, covering about 260 hectares or 0.5% of the land area of B&NES
- B&NES’s net carbon emissions will reduce by 87% from 367,000 Mte to 46,000 Mte assuming grid decarbonisation reduces carbon intensity from 560g/kWh to 100g/kWh
- These figures make a number of assumptions outlined below and don’t include increased electricity consumption from transport and heating which will be dealt with in subsequent analyses
Consumption Trends
Household and commercial electricity consumption in B&NES is declining:
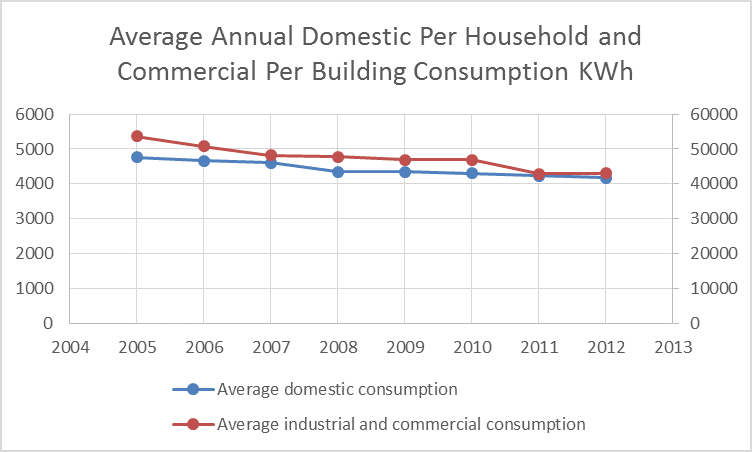
at about 2% per year for households and at 3% per year for commercial premises; this is most likely as a result of the purchasing of new more efficient appliances and lighting. The government’s Powering The Nation report suggests there is further potential for households to save an extra 20% if they all moved to A and A+ rated appliances and more efficient lighting. Therefore for our projections we feel that a continued per household reduction of 2% per year for the next 15 years is not unreasonable as appliances become more and more efficient. For commercial premises we also use a 2% predicted reduction which is below the current 3%, but some of this higher commercial reduction may be due to the recession and not efficiency measures.
If we factor in the 13,000 homes due to be built in B&NES over the next 15 years, a 16.5% increase in the number of homes and assume commercial premises grow by the same amount we get a 16.5% net reduction in consumption in B&NES over the next 15 years:
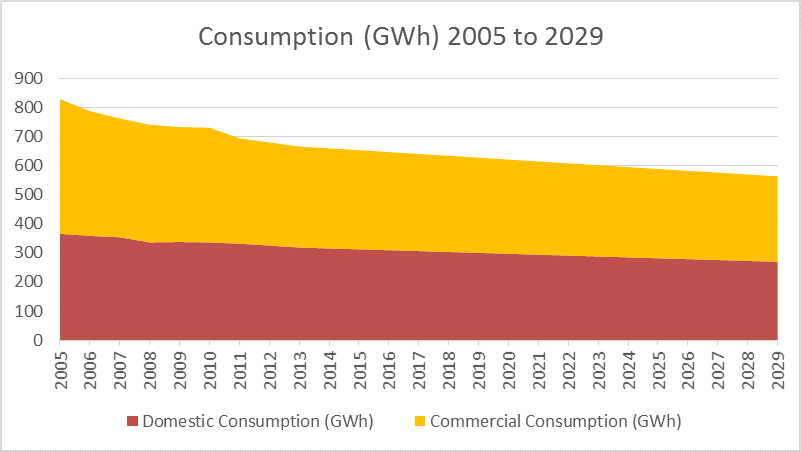
This assumes no consumption growth in other sectors like transport, something we will address in future analyses.
Renewable Electricity Generation
The council’s draft Community Energy Strategy and Core Strategy defines an annual increase in renewable energy capacity of 7 MW per year in B&NES. Unfortunately the strategy doesn’t define whether the capacity is solar PV, hydro or wind as each have significantly different ‘load factors’ and generate significantly different annual amounts of energy. For the purposes of this analysis we will assume that the significant majority of this additional capacity is solar PV as wind turbines are difficult from a planning perspective and hydro has limited potential.
To date most of the installed renewable energy capacity has come from domestic roof top solar PV:
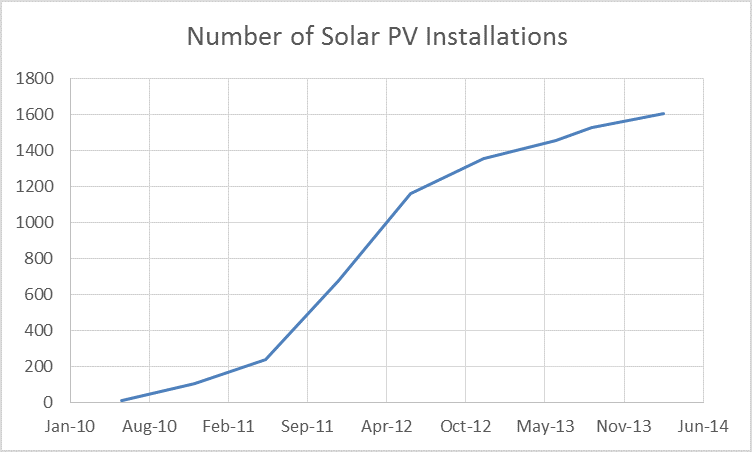
As of March 2014 there are about 1600 separate solar PV installations or about 2% of homes, so there is plenty of potential for further installations. If we assume on average their capacity is 3.5 kWp, then this installed base represents about 5.6 MWp, or about 4.8 GWh/year or about 0.7% of annual consumption. If we assume these largely domestic installations continue at their current post 2012 rate then they should continue to add about 0.7 MWp/year to B&NES’s capacity.
Combining the 7 MWp defined by the council for large scale commercial and community schemes, with the likely domestic installations provides an increase of about 7.7 MWp per year or about 6.5 GWh increase in renewable energy production per year:
Although this may seem a sharp increase in installations from almost nothing to 7.7 MWp per year, it is not unrealistic if you consider BWCE is currently installing a 2.35 MWp plant at Wilmington Farm and Green Switch Developments have applied for planning permission for a 7.44 MWp solar farm. In the short-term this run rate will be dependent on government policy and subsidies, in the long term once solar PV reaches grid parity it will be probably be limited by planning and the impact excess solar PV capacity might have on the grid.
Combining Consumption and Renewable Electricity Trend Predictions
Combining the consumption and renewable energy trend predictions provides us with the graph presented at the top of this article:
- which shows renewable electricity generation in B&NES reaching 18% of consumption by 2029
- if you combine this with DECC predictions for the decarbonisation of the grid from its current 560g/kWh to 100 g/kWh annual carbon emissions from electricity will reduce from 367,000 Mte to 46Mte an 87% reduction which would be very impressive if it happens, particularly as this includes a 16.5% increase in homes over the next 15 years
- the land area taken by these solar panels by 2029 will be 260 hectares or 0.5% of the land area of B&NES and significantly less than the 620 hectares which will be required for the new housing
The spreadsheet containing these calculations is available here and if you are interested in being involved in this project, helping to map out B&NES’s future carbon emissions please contact us at consultation@transitionbath.org ?